Have you ever lay awake (I had to google lay vs laid vs lain – I think that’s right) at night wondering how much energy and money you could save by switching to more efficient lighting? If so, prepare to be enlightened. Kevin and I both recently earned the Certified Energy Manager credential and wanted to flex our energy-audit-calculation-explaining-muscles a bit, while hopefully imparting a bit of knowledge for energy audits, the CEM exam, or otherwise. This is the first in a handful of posts, in no particular order, on how to calculate energy savings. We’ll start with an easy one first. Try this at home (or pay us and we'll do it for you).
Let’s say you have recessed lighting in your kitchen – 5 fixtures with one 55 watt flood light each. You want to know what you’ll save by replacing them with LED lamps (BR30s) at 13 watts each. Estimate how long they’re on per day, on average. Let’s assume 4 is hours is reasonable and you’re not leaving them on unnecessarily.
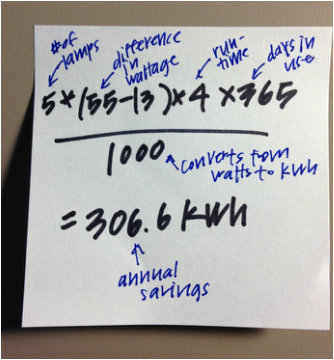
Energy Savings
Let’s say you have recessed lighting in your kitchen – 5 fixtures with one 55 watt flood light each. You want to know what you’ll save by replacing them with LED lamps (BR30s) at 13 watts each. Estimate how long they’re on per day, on average. Let’s assume 4 is hours is reasonable and you’re not leaving them on unnecessarily.
Energy Savings
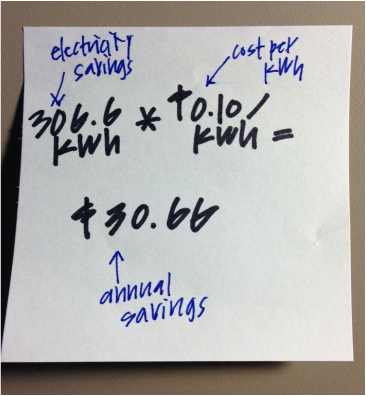
Annual Cost Savings
Look at your utility bill to see how much you pay for electricity consumption. Let’s assume 10 cents per kWh.
Look at your utility bill to see how much you pay for electricity consumption. Let’s assume 10 cents per kWh.
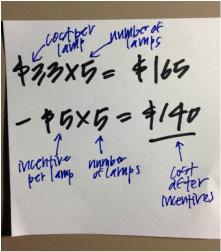
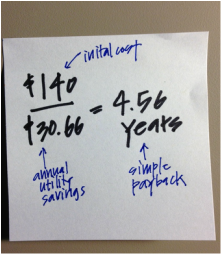
Simple Payback
BR30 LEDs start around $30 dollars. MassSave has rebates/incentives for qualifying products for residential projects as well as commercial projects (which are under the Bright Opportunities program - no relation to Kevin). Let's assume an incentive of $5 per lamp. There is no labor cost if you do it yourself, but this is where you’d add labor.
BR30 LEDs start around $30 dollars. MassSave has rebates/incentives for qualifying products for residential projects as well as commercial projects (which are under the Bright Opportunities program - no relation to Kevin). Let's assume an incentive of $5 per lamp. There is no labor cost if you do it yourself, but this is where you’d add labor.
| 
|
So it pays for itself in 4.5 years. As you can see from the equations, if you focus your efforts on your highest wattage lamps that are on the most, the savings will be greater and it’ll pay for itself even faster.
 RSS Feed